Current Activity
Jim Chapple is now working full time on iphone/ipod touch and iPad applications.
Jim Chapple also works on Mac OS X Apps.
Please email Jim Chapple for support issues, information and quotes.
Weight Monitor
- Have you been trying to lose weight but lost heart each time your weight increased when you'd tried your hardest? Yes, well this App tries to correct this by showing you you averaged weight across a ten day period. On a day to day basis your weight can fluctuate because of many factors, water retention being one of them, this App takes each weight and averages it with the last 10 days worth of weights. This average is a much better indication of your real weight.
- Record your weight in kilos, pounds or stones & pounds. Shows you your weights plotted on a graph.
- Shows you your average weight across the last ten days. A much better indication of your real weight. Because it is an average across a number of days the rolling average weight is not so affected when you weight radically changes.

The small thumbnail images below will show larger iPad screenshots.


The following screenshots are from the iPhone. If you have the iPad version then the main differences are:
- The graph showing weights, trends and required weight loss line is shown on the main page.
- You can now select a date from the picker wheel and then select the weight for that day and save all on the main page.
FAQ: This App does not work properly it keeps on crashing, why?
Sometimes Apps just do not download properly. You will need to download it again, for free, using itunes. See Apple Support Pages
About half way down the page there's a set of instructions that starts 'Reinstall the affected application'.
Once iTunes has it then you sync your device and it should then work. If it does not then please to contact me.

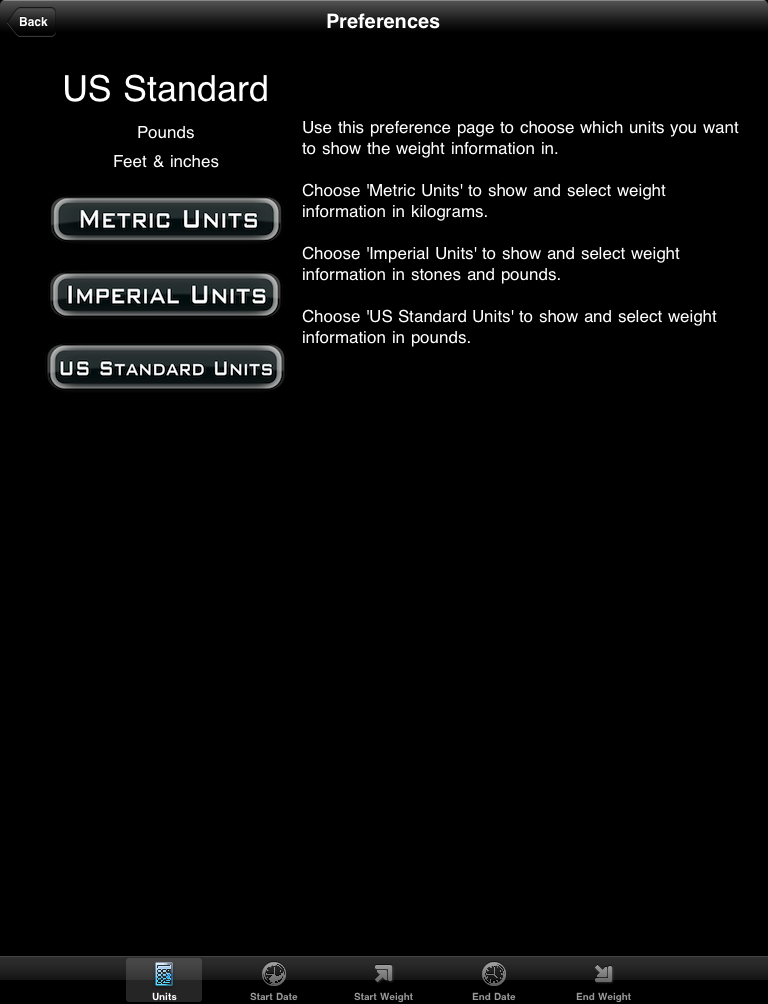
When the Application StartsWhen you start the App for the first time you are taken straight to the Preferences Page. You have to set your preferences before the App can work. The following five sceeenshots show the five pages that are used to set the preferences for the App. The tabs at the bottom of the page are used to navigate to each page. When being used for the first time the 'Back' button will not be available. You have to set the five preferences before the App can run properly. When you have set all five preference then the view will change automatically to the Graph View. Use this page to set how you want to enter and view your weights. Select from Kilograms, Stones and Pounds and Pounds only. |
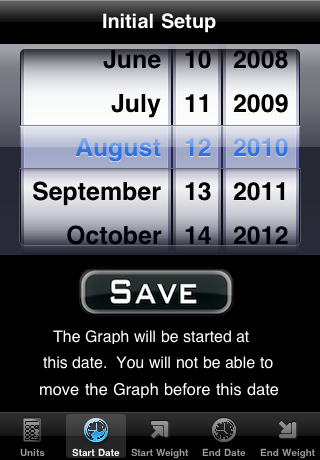
Use the date picker to set the start date for the weights. This date is the date the Graph View starts from. |

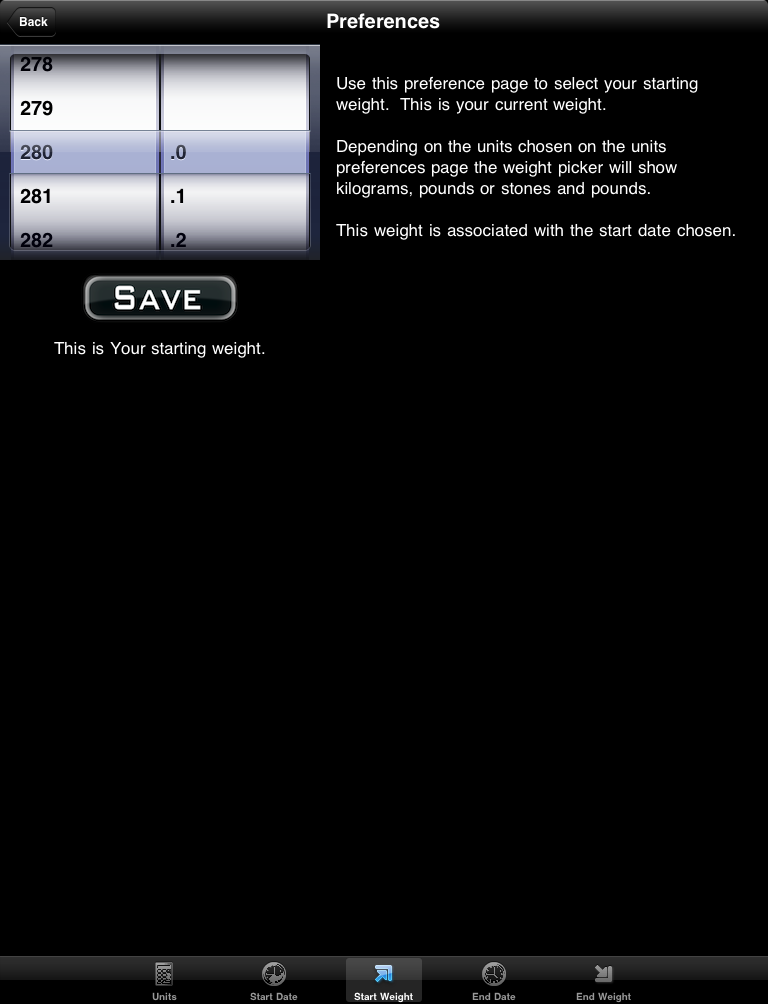
Use this weight picker to set your start weight. This screenshot shows the weights using the Stones and pounds (Imperial) option but if you have selected one of the other options then the weights will be shown be in that format. |

Use the date picker to set the end date for the weights. This date is the date the Graph View end. Generally this weight will be a number of months after the start date. |

Use this weight picker to set your end weight. This is the weight you want to be on the end date selected. This screenshot shows the weights using the Stones and pounds (Imperial) option but if you have selected one of the other options then the weights will be shown be in that format. |
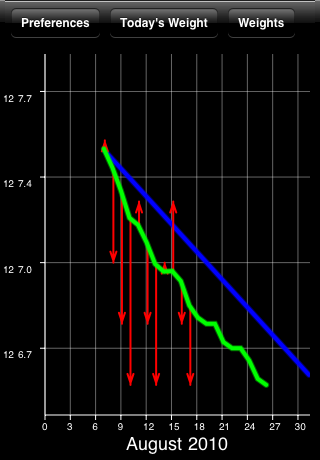
The Main Screen - Weight GraphThis page shows (stones and pounds selected) the weights that have been entered. Swiping left to right from moves the graph view to the previous month's graph. Swiping right to left shows you next month's graph. The end of the arrow of each red line shows the weight for the day. The line extends to the rolling average weight for the day. If the arrow is downward then your weight is going in the right direction. If the arrow is upward then beware your weight is above the average. |
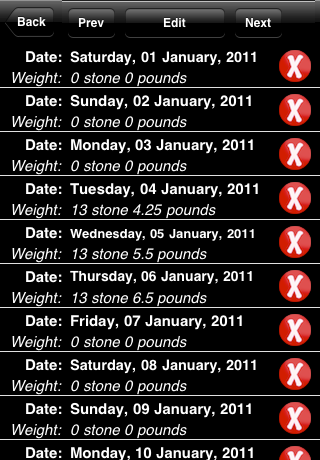
A Month of WeightsSelect the Weights option in the Graph View and your are taken to the Month View. This view shows you all of the weights you have entered. This screenshot shows Stones and Pounds for the weights but if you have selected one of the other options then you will see your weights in that format. Select back to return to the graph view. Select Prev to see last months, select Next will show you the next month's weight. |
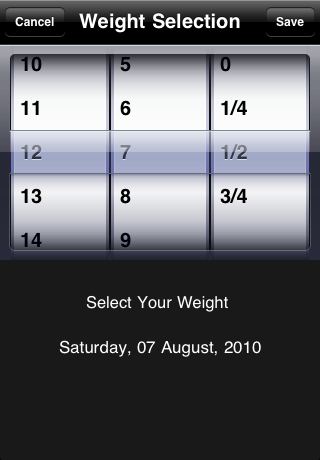
Select the line on the Month view and select Edit and you will see this view. Once again if you selected one of the other options you will see this picker in that format. Enter your weight and select save and you will return to the month view. Select back now and see the your new weight plotted on the graph. Instantly see how the new weight affects the rolling average. |
|
After the final weight (generally today's weight) the green rolling average line projects forward in time by ten days. The values used for this line are calculated just like all the other rolling average values. When it projects beyond today it is still doing an average across the last 10 days for each of the 10 projected days. But for each of the projected days (beyond today) the last known value is used, in this case the today value. So, for example, for day 5 after today the 10 values used are today, the four days before today and the next 5 future days that are all assumed to be the same as today; the average of these 10 values is the value for today + 5. So the last projected value is the same weight as today's weight, since all of the values used are today's weight. What this is showing you is if nothing changed in 10 days this would be your weight. It is just a projection of your future weight so there's no guarantee that it will be correct but it at least give you something to aim for. This can be seen in the screenshot. The projected value for the 24th January is based on the last 10 days. Since the value for the 17th is lower than all the other values the projected value goes down slightly. The same happens for the next few days and then the low value on the 15th is no longer used for the projections and the value shows a slight increase but ultimately the final values are all tending towards the last known value recorded on the 23rd. |