Current Activity
Jim Chapple is now working full time on iphone/ipod touch and iPad applications.
Jim Chapple also works on Mac OS X Apps.
Please email Jim Chapple for support issues, information and quotes.
Mandelbrot Set Image Generator
This App generates fractal images with the Mandelbrot set space. The user then colours the image based on some simple rules.
- Select two points in the Mandelbrot Set space and generate the new image for that area.
- Select what colours are to be used to colour in the image. Up to 1024 different colours can be used.
- Save the resulting image so that you can print it out, email it to someone, etc.
- The App uses as many processors that are available to generate the image thus speeding up the time taken to generate an image.

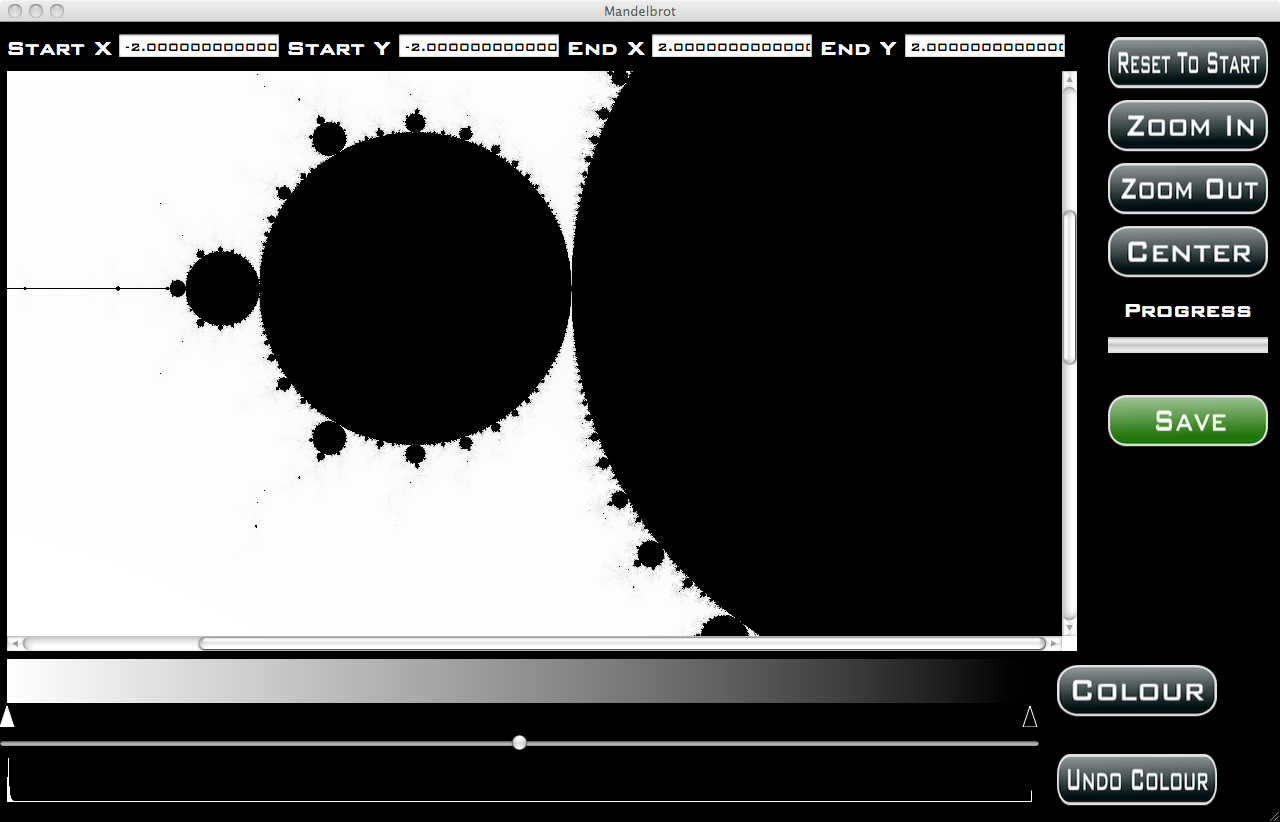
When the App StartsWhen the App starts the image shown is the complete area of the Mandelbrot set. Each pixel of the image has been calculated based on the number of iterations of a formula it took for the value to be greater than the value 4. At this point the image is rather lifeless and dull because only two colours are being used to colour the image. You can see these colours underneath the image: white to the left and black to the right (the triangles below the colour bar show the colours selected). The colour bar shows the colours that will be used to colour the image. The colour bar has 1024 positions each one corresponds to a number of iterations. All pixels are coloured based on the number of iterations they took, so if a pixel took 512 iterations then its colour will be in the 512th place on the colour bar. Below this is a slider which can be used to select the position to place a colour. Below that is a histogram that conveys the number of pixels that are at each iteration value. So for the initial image most of the pixels only took a few iterations to go over the value 4. This can be seen in the histogram because the spikes are mostly down at the white end of the spectrum. This gives you an idea as to where to place your colours. If you want yellow to be your dominate colour then place it down where the spikes are. |
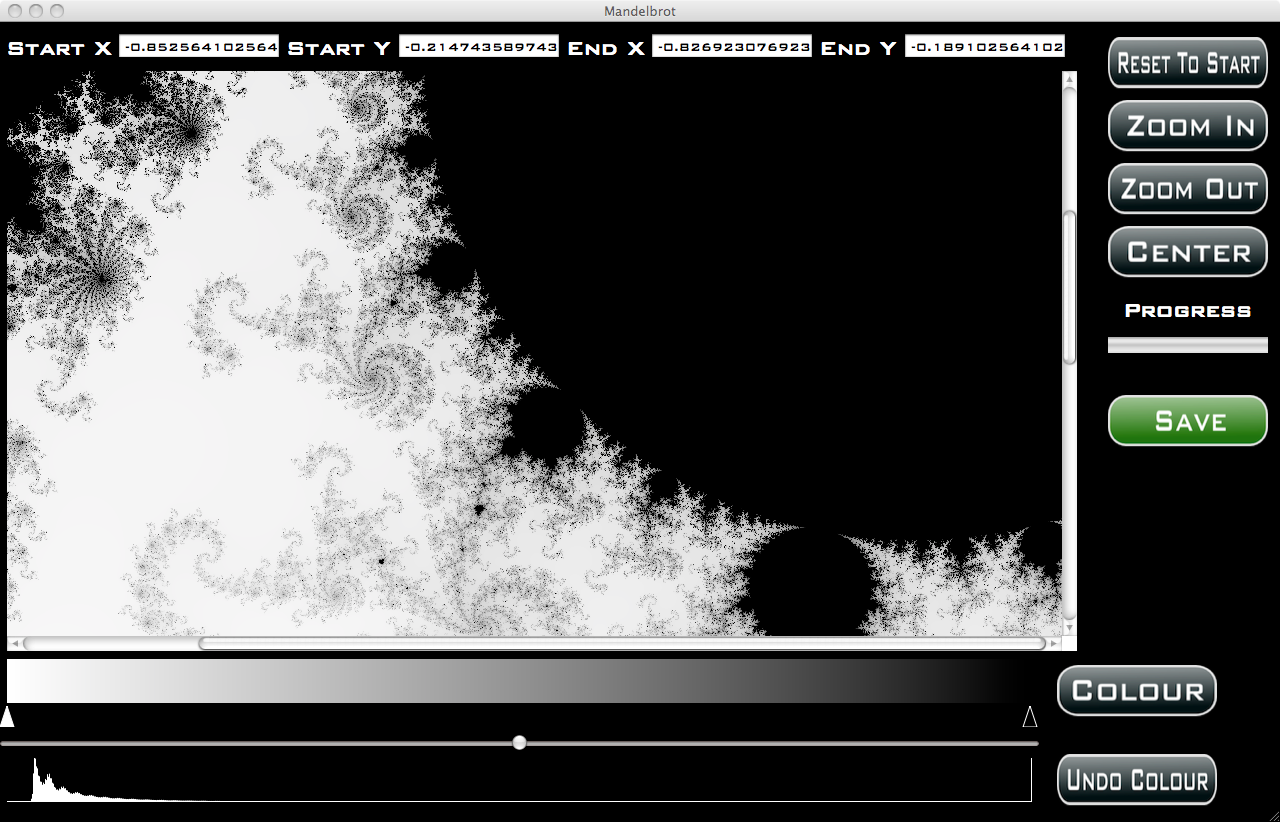
Zooming the imageThis image is a very small area of the previous image. More detail is emerging even though only two colours are being used. To zoom the image you have to define new the area of the image to be calculated. You do this by clicking on the image to select the new area, the area is defined by its top left and bottom right points. You must select top left first and then bottom right. This defines a box that is the area to be calculated. If the area you defined is not square then it is adjusted so that it is. Each image is always square. If you look down at the histogram you can see why more detail is emerging. The histogram has spread out and has moved to the right. This means that more of the pixels have differing iteration values so more colours are being used to colour the image. |
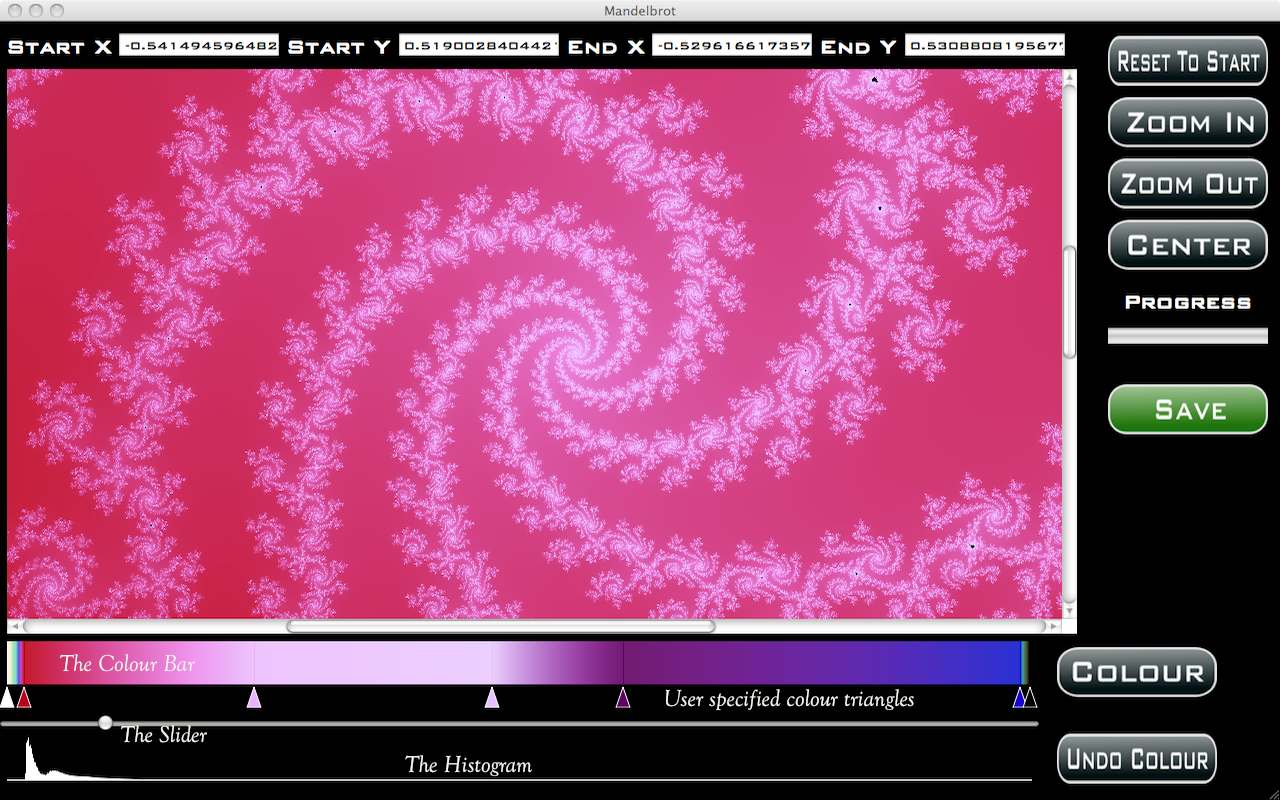
Colouring the ImageNow the fun part starts - colouring the image. This image uses seven colours spread out across the colour bar. If you look at the colours used (each user defined colour is a represented by a triangle) they define the colour for an iteration value. Move to the next user defined colour and the colours change between the two to take you from one colour to the next. So you only have to define a few colours to get a rich selection of colours to colour the image. This image is mostly red to pink because these are the colours that match the spikes in the histogram. How to colour an ImageFirst press the 'Colour' button. A small colour picker window is opened. Using this you can select the colour you want to use. Next , move the slider (below the colour bar) to the position you want to place the colour. Finally, select the 'Colour' button again and the colour from the colour picker is placed at that point. The App takes this colour and adjusts the colour bar to take it into account. Basically, it looks either side of the new colour's position to find the next user defined colour and adjusts the intermediate colours to change from the new colour to the next colour either side. The image is then re-coloured using this new colour map. Moving a colourEach user specified colour is shown by a triangle of that colour and is placed where the slider was. But this is not all that can be done. Colours can be moved. Just click on a colour's triangle and drag it to its new position. The image will be re-coloured using the resulting colour bar colours. Undo Colour: If you do not like the new colour and the affect it has had on the colours then just press 'Undo Colour' and the last colour change will be undone. If you have just added the colour then the colour will be removed. If you have just moved a colour then it will be moved back to where it came from. |

Other commandsReset to Start: Press this button and everything is reset back to the start. There's no undo on this action so be careful. Zoom Out: Press this button and the area of the image will be zoomed out so that more can be seen. The zoom out doubles the area viewed each time it is pressed. This is useful when you've zoomed in just too far. Zoom out will double the area shown and then you can select the area you wanted. Zoom In: Press this button and the area of the image will be zoomed into the center. The zoom in halves the area viewed each time it is pressed. Center: Press this button to center the area on a specific point. Select the point and then press Center. The area is moved so that the point selected is in the center of the area. Useful when you want to take a feature of the image and make it the focus of the image. Save: Press this button and the current image is saved. You choose the name and location and the image is written to that file. You can then do whatever you want with the image generated. |

SimplicitySometimes less is more as the saying goes. In this case there are only four colour selections and actually only two user selected colours - black and white. The image though has a whole range of greyscale colours. The histogram itself shows a large range of iteration values that have been used to generate this image. |